

모니터링이란
시스템의 성능, 안정성 및 가용성을 실시간으로 관찰하고 측정하는 과정을 의미한다.
잠재적인 문제를 신속하게 발견하여 대응할 수 있다.
Spring Boot Actuator
Spring Boot 애플리케이션의 상태 및 내부 동작을 모니터링하고 관리하기 위한 기능을 제공한다.
# Actuator 엔드포인트를 19090 포트에서 서비스하도록 설정
management.server.port=19090

#모든 엔드포인트 노출 설정
management.endpoints.web.exposure.include=*

#헬스 체크 엔드포인트 상세 정보 표시 설정
# 이 설정은 /actuator/health 엔드포인트에서 헬스 체크 정보를 항상 상세히 보여주도록 설정합니다. 기본적으로, 헬스 체크 엔드포인트는 요약된 상태 정보만 제공하며, 상세 정보는 노출되지 않습니다.
management.endpoint.health.show-details=always
Prometheus
오픈소스 모니터링 시스템으로, 주로 애플리케이션, 서버, 데이터베이스 등 다양한 시스템에서 메트릭을 수집하고 저장한다.
수집한 메트릭을 기반으로 시각화 및 경보를 설정할 수 있다.
- Grafana : Prometheus 데이터를 시각화하기 위해 자주 사용되는 대시보드 도구
Prometheus에서 수집한 메트릭 데이터를 대시보드 형태로 시각화할 수 있다.
Prometheus 설정 파일
Prometheus가 모니터링할 타겟과 설정을 정의하는 설정 파일 prometheus.yml 생성
global:
  scrape_interval: 15s

scrape_configs:
  - job_name: 'spring-boot'
    metrics_path: '/actuator/prometheus'
    static_configs:
      - targets: ['host.docker.internal:8080']
host.docker.internal :
Docker에서 제공하는 특수한 DNS 이름.
컨테이너 내부에서 호스트의 네트워크 서비스에 접근할 수 있다.
Prometheus 실행
Docker 명령어를 사용해 Prometheus 컨테이너 실행
docker run -d --name=prometheus -p 9090:9090 -v {prometheus.yml 경로}:/etc/prometheus/prometheus.yml prom/prometheus
Grafana
오픈소스 데이터 시각화 및 모니터링 도구로 대시보드를 생성하고, 데이터를 그래프나 차트 형태로 표현하며, 알림 기능을 제공하여 모니터링을 강화할 수 있다.
docker run -d --name=grafana -p 3000:3000 grafana/grafana
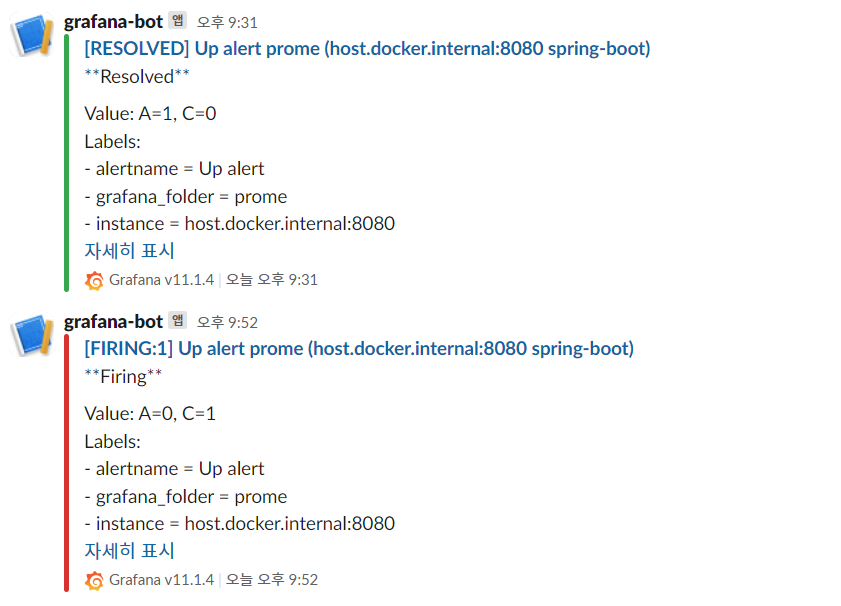
그라파나에서 slack으로 alert 보내기 (과정은 생략 ㅇㅅㅇ,,)
Loki
Grafana Labs에서 개발한 로그 집계 시스템으로, Prometheus의 메트릭 수집 방식과 유사하게 로그 데이터를 수집하고 쿼리할 수 있도록 설계되었다.
Loki는 주로 로그 데이터를 저장하고, 이를 Grafana를 통해 시각화하는 데 사용된다.
라벨 기반의 메타데이터를 사용하여 로그를 효율적으로 검색할 수 있다.
gradle.build에 의존성 추가
implementation 'com.github.loki4j:loki-logback-appender:1.5.1'
SampleController.java
import jakarta.servlet.http.HttpServletResponse;
import org.slf4j.Logger;
import org.slf4j.LoggerFactory;
import org.springframework.web.bind.annotation.GetMapping;
import org.springframework.web.bind.annotation.RestController;

import java.io.IOException;


@RestController
public class SampleController {

    private static final Logger logger = LoggerFactory.getLogger(SampleController.class);

    @GetMapping("/")
    public String hello(HttpServletResponse response) throws IOException {
        logger.info("Attempted access to / endpoint resulted in 403 Forbidden");
        response.sendError(HttpServletResponse.SC_FORBIDDEN, "Access Denied");
        return null;
    }
}
resources/logback.xml 파일을 생성
<configuration>
    <appender name="LOKI" class="com.github.loki4j.logback.Loki4jAppender">
        <http>
            <url>http://localhost:3100/loki/api/v1/push</url>
        </http>
        <format>
            <label>
                <pattern>app=my-app,host=${HOSTNAME}</pattern>
            </label>
            <message class="com.github.loki4j.logback.JsonLayout" />
        </format>
    </appender>

    <root level="DEBUG">
    <appender-ref ref="LOKI" />
    </root>
</configuration>
loki-config.yml 파일 생
auth_enabled: false

server:
  http_listen_port: 3100
  grpc_listen_port: 9096

common:
  instance_addr: 127.0.0.1
  path_prefix: /tmp/loki
  storage:
    filesystem:
      chunks_directory: /tmp/loki/chunks
      rules_directory: /tmp/loki/rules
  replication_factor: 1
  ring:
    kvstore:
      store: inmemory

query_range:
  results_cache:
    cache:
      embedded_cache:
        enabled: true
        max_size_mb: 100

schema_config:
  configs:
    - from: 2020-10-24
      store: tsdb
      object_store: filesystem
      schema: v13
      index:
        prefix: index_
        period: 24h

ruler:
  alertmanager_url: http://localhost:9093

# By default, Loki will send anonymous, but uniquely-identifiable usage and configuration
# analytics to Grafana Labs. These statistics are sent to https://stats.grafana.org/
#
# Statistics help us better understand how Loki is used, and they show us performance
# levels for most users. This helps us prioritize features and documentation.
# For more information on what's sent, look at
# https://github.com/grafana/loki/blob/main/pkg/analytics/stats.go
# Refer to the buildReport method to see what goes into a report.
#
# If you would like to disable reporting, uncomment the following lines:
#analytics:
#  reporting_enabled: false
도커 컨테이너 실행
docker run --name loki -d -v ${loki-config.yml 이 저장된 폴더}:/mnt/config -p 3100:3100 grafana/loki:3.0.0 --config.file=/mnt/config/loki-config.yml-config.file로 할때 flag provided but not defined: -config 오류나서
--config.file로 실행하였다.
그라파나에서 로그 확인
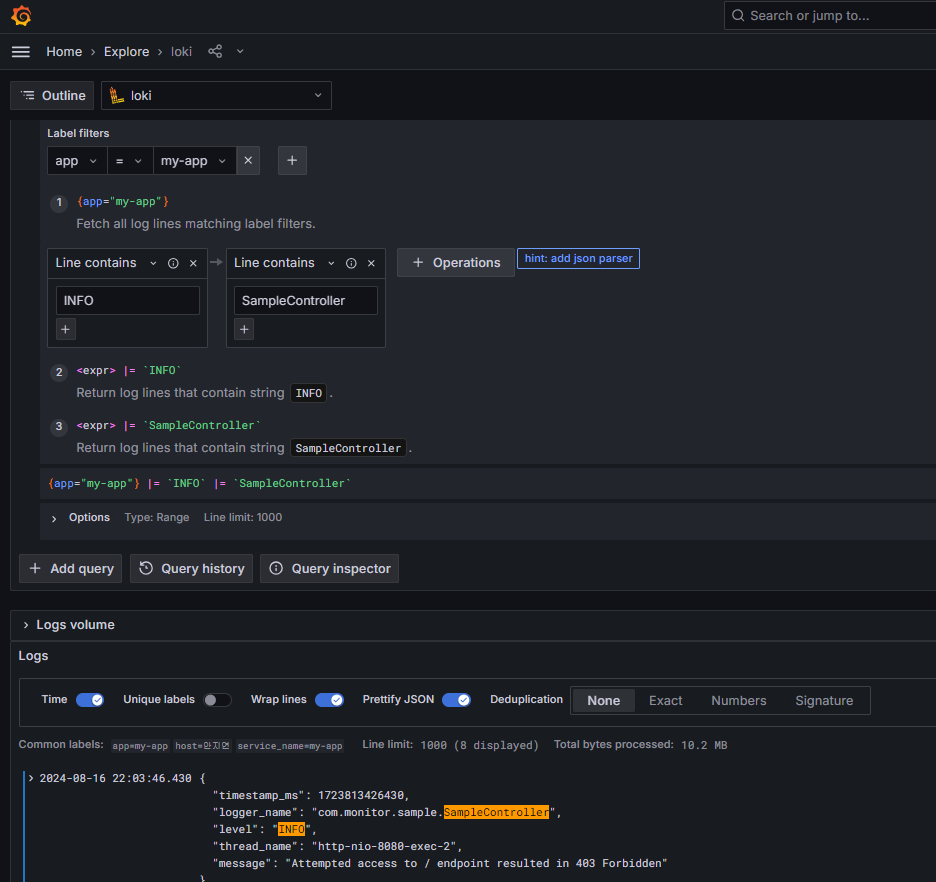
스프링에서 프로메테우스 서버로 로그 전송
> 프로메테우스가 로그를 수집함
> 그라파나가 그 로그를 수집해서 대시보드로 보여줌
'TIL' 카테고리의 다른 글
| [TIL] DB Lock | 비관적 락 (Pessimistic Locking) | 낙관적 락 (Optimistic Locking) (0) | 2024.08.20 |
|---|---|
| [TIL] Session Clustering (0) | 2024.08.17 |
| [TIL] SAGA Pattern (0) | 2024.08.16 |
| [TIL] Kafka란? (0) | 2024.08.15 |
| [TIL] RabbitMQ 이해하기 (0) | 2024.08.13 |